
Hand-Building My First LoRa Demodulator | True Color Is a Lie | GaianSpace CTF 2026
🌐 中文版:繁體中文
Second post in the series, and the one where we actually start hand-building a LoRa demodulator. The previous challenge, Channel Hop, just read an already-decoded packet log. From here on we get raw IQ and have to do everything ourselves.
This demodulator sticks with me all the way to the end of the series, so this post goes into more detail to lay out the skeleton of LoRa demodulation. The later posts only cover what’s different about each one.
Rest of the series: Isodata Seven、Subsidy Claim、Two Voices、No Name on the Door、Hopscotch
What the challenge is about
On the second satellite pass the tractor accepts the map and the sprayer rolls out. But the lead unit, Johnripper, marks every green thing on the map as “dead” and fertilizes at maximum dose. Babb walked the field an hour ago, and the corn was perfectly fine.
The shared SDR recorded the raw signal on the AgriLink frequency this time. AgriLink says there was only one transmission on this pass; the SDR disagrees. And since last night, AgriLink has been sending channels without names (to save airtime), ordered by the mast according to band_order.conf, a file that was rewritten at 02:13 by a remote session nobody remembers opening.
Goal: figure out what AgriLink actually transmitted. The files given are a ~200 MB .sigmf-data (ci8, 2 MS/s, 434.3 MHz), the band-order config, and the true-colour image shown on the tablet.
Flag format: GAIANSPACE{...}.
The skeleton of a LoRa demodulator
The signal is LoRa, but the parameters in the notes (BW250k) are a decoy. Measured for real, it’s SF7, BW500k. There’s no off-the-shelf decoder here, so we write our own.
First, what LoRa looks like. Each LoRa symbol is a tone that sweeps from low frequency up to high, called an up-chirp; on a spectrogram it’s a diagonal line. One burst looks like this (frequency on the vertical axis, time on the horizontal):
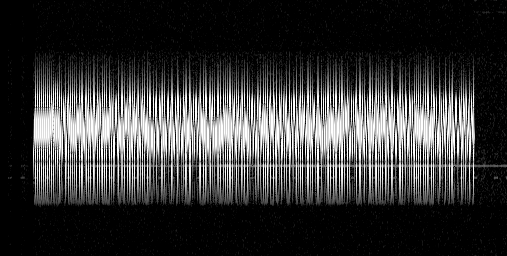
So how is data encoded? Each symbol “launches” from a different starting frequency, and that starting point is the number the symbol represents (0–127, so 128 possibilities for SF7). The core of demodulation is therefore measuring where each symbol launches from.
The technique is called dechirping: multiply the received up-chirp by a down-chirp going the opposite way. One sweeps up, one sweeps down, their slopes cancel exactly, and the product becomes a steady, single-frequency tone. Whichever FFT bin that tone lands in maps directly to the symbol’s launch point.
The figure below shows this (blue = received up-chirp, grey = down-chirp reference, red = the steady tone after multiplying):
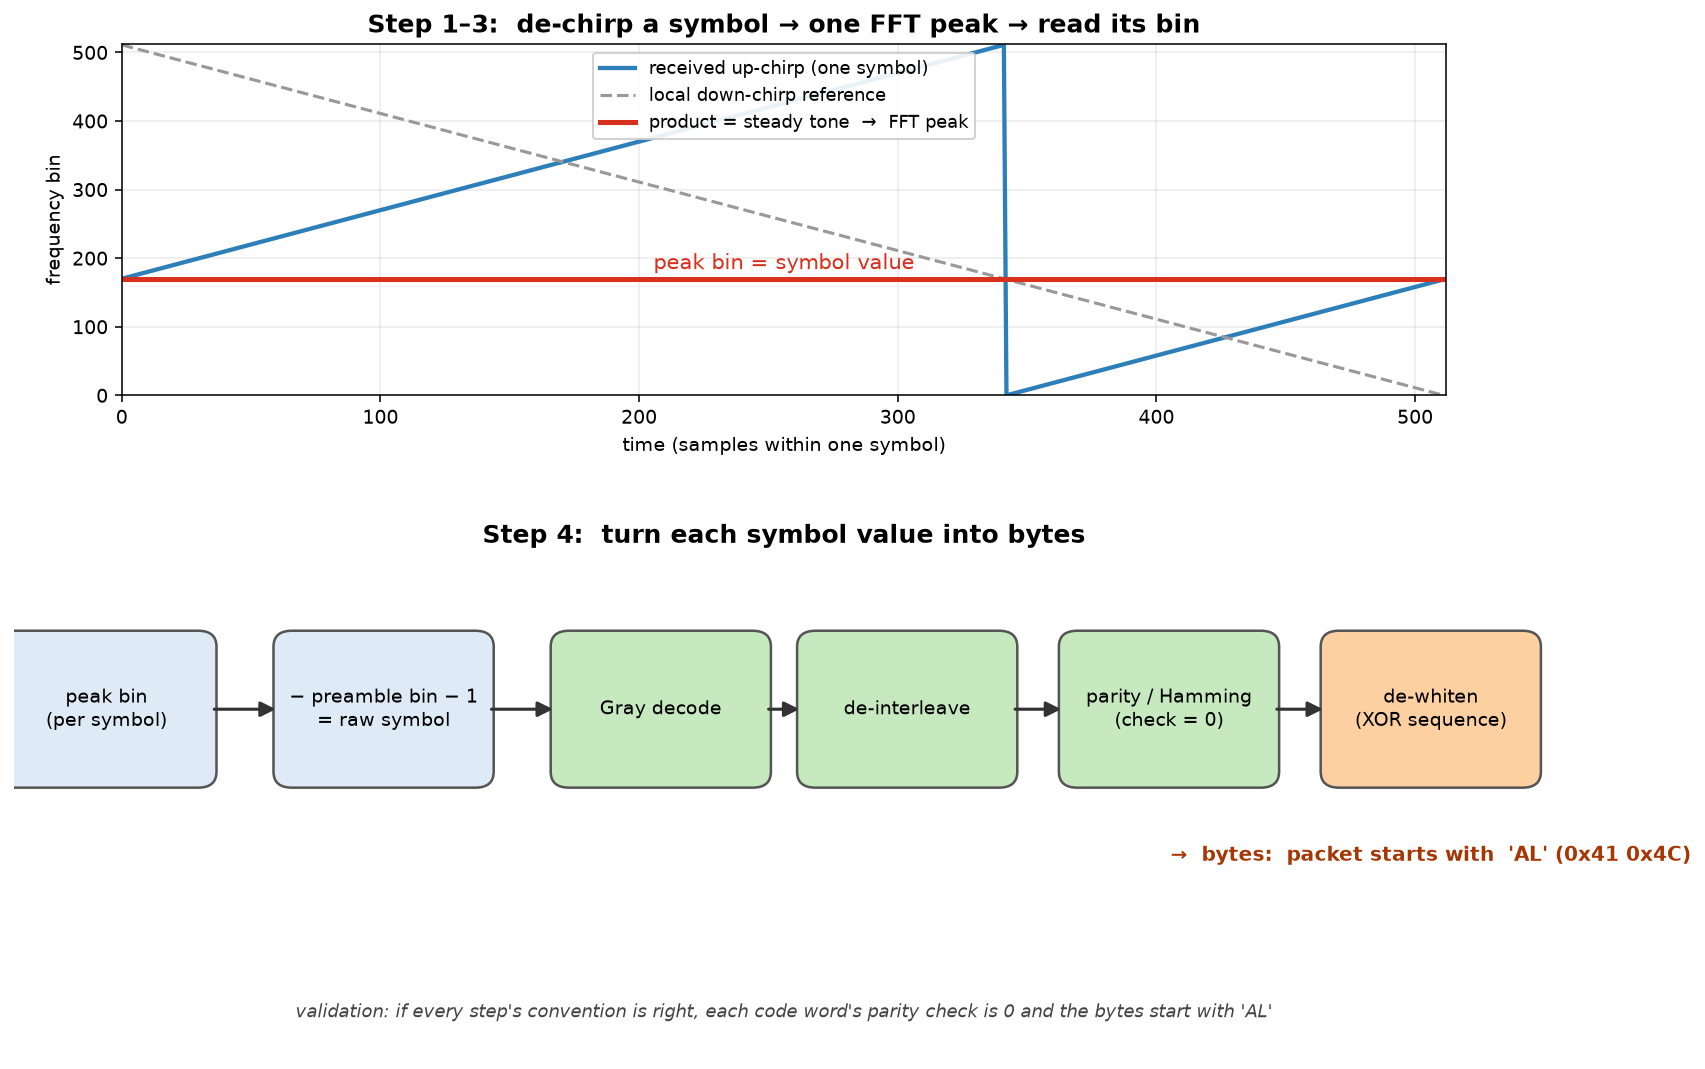
The full pipeline (used in every post from here on):
- Synchronize first. Run one FFT over the preamble’s up-chirps and one over the following down-chirps; the two peaks together give you both the timing (which sample the packet starts on) and the carrier frequency offset (CFO, the frequency difference from imperfect crystals on each end). See “the half-symbol trap” below.
- Dechirp each symbol and take the peak bin. One implementation detail matters: do it at the native 2 MS/s rate (512 samples per symbol), add up the two energy chunks that fold into
vandv−128, then take the peak with parabolic interpolation. Downsampling to 500 kS/s first loses edge energy and raises the error rate. - Symbol value = peak bin − preamble bin − 1 (subtract the preamble’s reference start point).
- Turn symbol values into bytes: Gray decode → de-interleave → take the data bits → assemble bytes → XOR with the whitening sequence. How do you know each step’s direction (bit order, endianness) is right? Validate with known plaintext: these packets all start with
AL(0x41 0x4c), and when decoded correctly every code word’s parity check comes out 0. If it doesn’t, some step’s convention is flipped.
The half-symbol trap (detail of step 1)
There’s an easy trap during step 1’s synchronization: the packet start resolves to two equally valid answers, and the formula alone can’t tell which is right.
Why? After dechirping you take the FFT peak bin, and FFT bins are circular (the bin after 127 wraps back to 0).
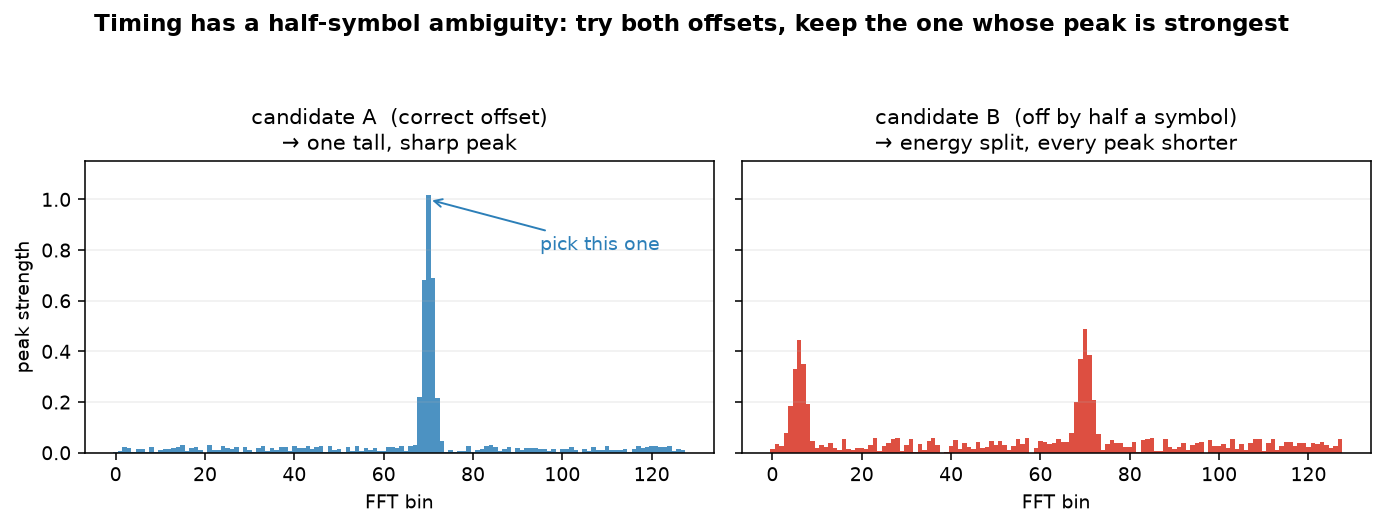
That “wrap-around” means the computed packet start lands on two candidate offsets that differ by exactly half a symbol (64 bins for SF7), and both line up with the preamble when plugged into the formula, so you can’t pick one by formula alone.
The fix is crude but effective:
Decode with both candidates and keep the one whose FFT peaks are tall and clean. When the alignment is right, each symbol’s energy concentrates into a single bin and the peak is tall and sharp. Off by half a symbol, the energy spills into the neighbouring symbol and splits into two short peaks, which is easy to tell apart at a glance:
Two transmitters, one strong and one weak
After decoding all 781 bursts, the truth comes out: there are actually two transmitters on this frequency.
- Weak signal (641 bursts): 5 channels × 128 rows, a complete tile. This is the real satellite data.
- Strong signal (139 bursts): far stronger, but it only re-sends some rows of ch0 and ch3, and its contents are a tampered version of the weak signal.
That’s the lie underneath a “single transmission”: one real satellite, and a forged transmitter talking over it.
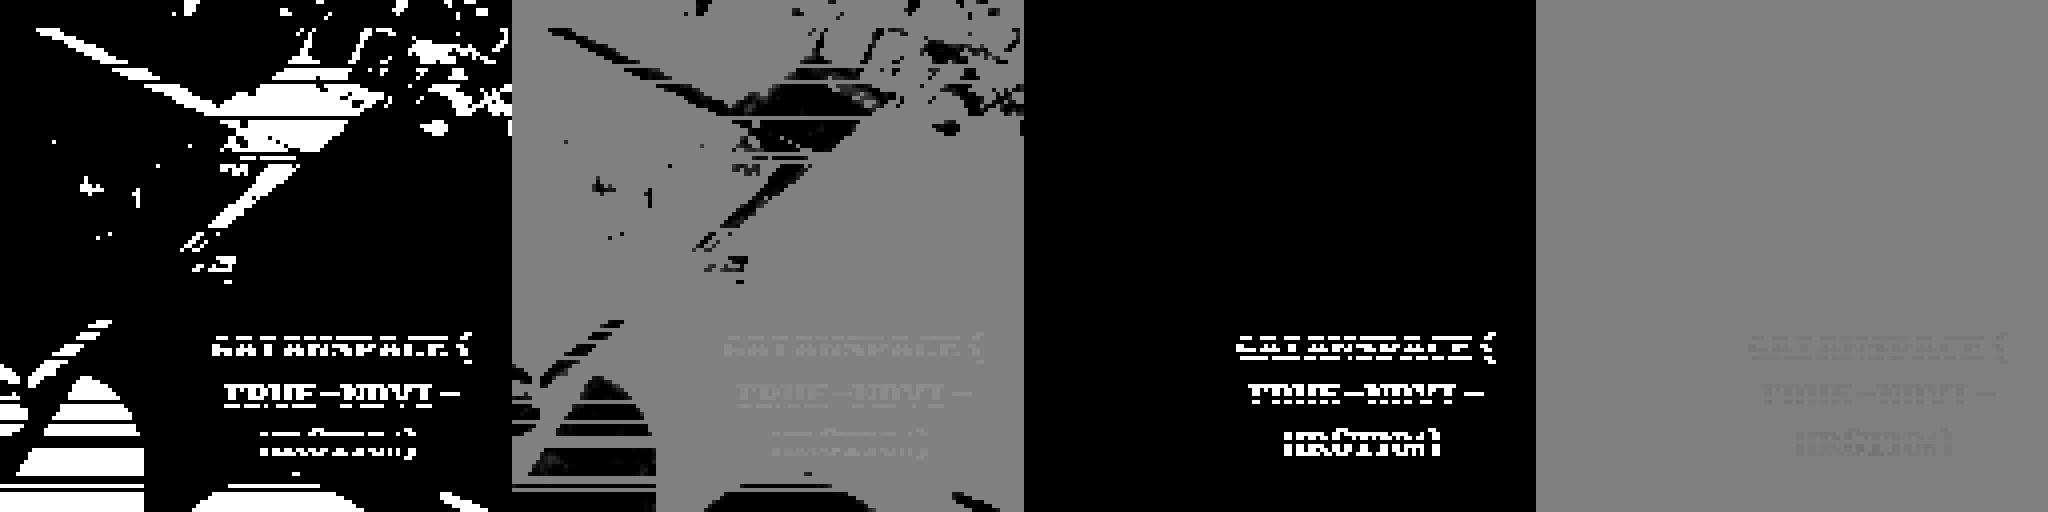
The mast received the stronger one, so it used the altered data. Subtract the weak version from the strong version for the same (channel, row), and the ch3 difference spells out three lines of text:
Reading the last line
The strong signal was initially missing a few rows that failed to demodulate, so the text had horizontal gaps. After fixing the half-symbol ambiguity and filling in all the rows, the glyphs came together. The last line’s characters are only 5 pixels wide and a bit blurry, so I upscaled with cubic interpolation and checked them cell by cell:
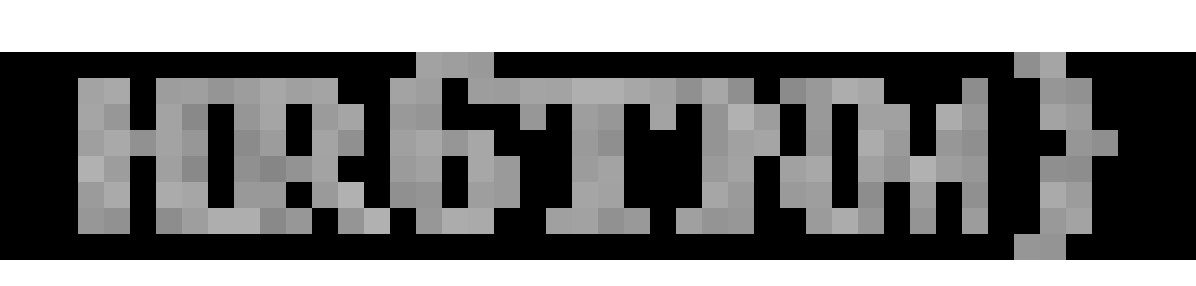
Reads HR6TNM.
Flag
1 | GAIANSPACE{TRUE-NDVI-HR6TNM} |
The flag name TRUE-NDVI echoes the challenge too: the channels the forger tampered with, ch0 and ch3, are exactly the ones the mast treats as red and short-wave infrared, and red is the key band for computing NDVI (the vegetation index).
That’s why the tractor judged healthy corn to be dead.
Takeaways
- A “single transmission” can have two transmitters. The strong one drowns out the weak one (capture effect), and only the raw SDR IQ can tell them apart. The log only shows the one that got received.
- The hardest part of LoRa demodulation is synchronization. CFO and timing are coupled together across the up/down chirps; you separate them using their difference and sum, and there’s the half-symbol ambiguity. Once this skeleton is correct, the rest of the series is just bolting features onto it.
- When rolling your own, validate every convention with known plaintext. Here, the
ALprefix and the header nibble confirm the direction of Gray/de-interleave/byte-order, far faster than cross-referencing the LoRa spec from memory. - The message hides in the difference between two “noisy” copies. Neither version alone reveals the tampering; only the subtraction does, a trick that returns in a different form in Isodata Seven.
If you find my articles helpful, please support Kevin!
 Use boba to safe Kevin!